We asked voters to rate themselves on a scale from 1 to 10, with 1 being “extremely liberal/progressive” and 10 being “extremely conservative.” We also asked them to place the four major candidates for Senate (Talarico, Crockett, Cornyn, and Paxton) on the same scale. Here’s what we learned about Texas primary voters:


We additionally asked Democratic primary voters a series of questions about whether they felt certain ideological labels—socialist, progressive, liberal, and moderate—applied to them. These were not mutually exclusive; we allowed voters to say yes or no to any of them, and we found that ideological identities among Democratic primary voters are highly overlapping rather than mutually exclusive.
We also asked Democratic voters for their views on where the Democratic Party stands ideologically. A plurality (45%) said the Democratic Party represents their views well, while 37% said it is not progressive enough, and 18% said the party has gone too far to the left.
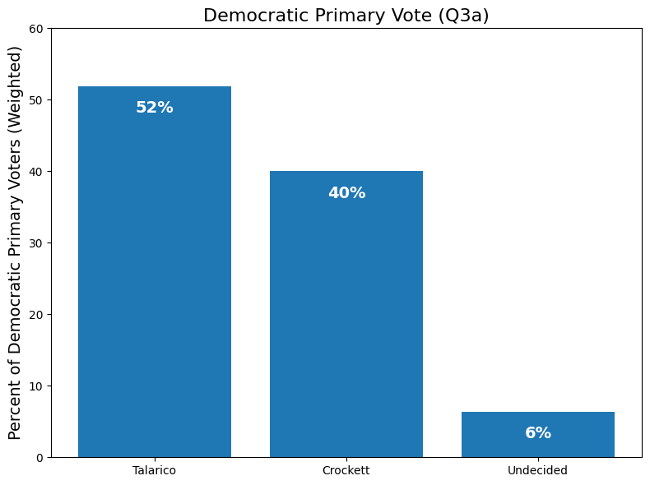
In the Democratic primary for U.S. Senate, James Talarico leads Jasmine Crockett 52%-40%. The landscape seems to have shifted somewhat over the last month, when most polls still showed a tight race between Talarico and Crockett.
There is not a strong ideological divide within the Democratic electorate—Talarico leads 60%-33% among voters who self-describe as socialists and 61%-34% among voters who self-describe as moderates. He has strong leads among Democrats who think the party has gone too far to the left (62%-22%) and among those who think the party is not progressive enough (53%-39%).
That said, on the 10-point ideological scale, Democratic primary voters rated themselves as a 3.79, Talarico as a 4.14 (0.35 more conservative) and Crockett a 3.26 (0.51 more liberal), so they did think Talarico’s views were closer to their own on average. Even Crockett voters (3.79) place themselves about as close to Talarico (4.37) as Crockett (3.23).

Interestingly, more than one in five respondents supported the candidate they considered further from themselves ideologically—and Talarico won these voters 56%-44%.
Instead of ideology, race seems to be the chief dividing line: Crockett still has near-universal support among Black voters—leading 95%-5%—while Talarico leads 74%-20% among white voters and 57%-28% among Hispanic voters.
Men favor Talarico by thirty points (61% Talarico-31% Crockett), while women are closely divided (45% Talarico-46% Crockett). Talarico leads 68%-25% among white women and 48%-35% among Hispanic women, while trailing Crockett 97%-3% among Black women. Black men also favor Crockett (92%-8%), while Talarico leads 81%-11% among white men and 68%-19% among Hispanic men.

Talarico is stronger with younger voters, leading 65%-26% among voters under 45, while the two are statistically tied among voters 45 and older (47% Talarico - 45% Crockett).
The two candidates are tied at 38% each among voters with a college degree, but Paxton leads Cornyn 45%-24% among those without a degree.
In a runoff scenario between the two, Paxton leads Cornyn 49%-36%. Wesley Hunt supporters back Paxton by a margin of 47%-29%.
A theoretical endorsement from Donald Trump seals the deal for Ken Paxton but would only marginally benefit John Cornyn. If Trump endorsed Cornyn, the race only moves slightly in his favor (44% Paxton-37% Cornyn), while if Trump endorsed Paxton, his lead grows to an insurmountable 56%-28%.
Ideologically, Republican primary voters place themselves to the right of both Paxton and Cornyn, who, at an average rating of 6.53, barely even qualifies as being on the conservative half of the spectrum for primary voters.

Beyond the Senate election, we tested a couple of other primary contests:
About the survey
This survey of likely primary voters was conducted February 23-24, 2026 statewide in Texas. Responses were collected via text-to-web. The overall sample size was 1,001, yielding a margin of error of +/-3.1%. The Republican primary sample was 529 (MOE +/-5.26%) and the Democratic primary sample was 472 (MOE +/-4.51%). Results were weighted to reflect the demographics of the likely primary electorate.
You can find the full weighted crosstabs and toplines here.
Interested in talking more about this survey? Email Brannon Miller at brannon@chismstrategies.com.